Our clients, like most organizations, struggle with the concept and practice of pay-for-performance for both their executives and, to a lesser extent, their broad-based employee population. Boards and management recognize that their compensation should be performance-based, but struggle with how it should be systematically implemented. This struggle occurs, particularly, when there is a desire to communicate the program prospectively to participants. By communicating upfront, the pay-for-performance program becomes a much more valuable tool to direct behavior toward and focus on desired outcomes – a tangible tool that Boards and management can use to affect organizational performance.
Regardless of their ownership structures (e.g., closely held, publicly traded, not-for-profit, etc.), part of the challenge organizations must address is their compensation philosophy and, more specifically, how they expect their executive compensation to align with executives in comparable labor markets. We often see existing compensation philosophies heavily focused on the levels at which various total direct compensation percentiles should be targeted – such as target base salaries at the 50th percentile, total cash at the 65th, and total direct at the 75th.
But why focus on how much you plan to pay?
We should target performance, not compensation. Compensation is simply a reward for a level of achievement based on its difficulty and value. What we should talk about is performance - in terms of inputs and outcome. We should talk about performance levels and the probability of achievement or the value the performance contributes to the company. Establishing payout opportunity that would deliver a specific level (e.g., 65th, 75th, etc.) of base salary, total cash or total direct is a simple analytic task; once the levels of performance required for payout are established. The challenge is determining the performance required to get the payout.
Overview of Setting Performance Levels
The first major hurdle is for the Board or assigned committee to establish the role of compensation in organizational performance and executive performance management – for the CEO in particular – and then establish and articulate a philosophy that supports these two. The philosophy should discuss the approach to pay – e.g., conservative, entrepreneurial, choice, variety, results-focused, effort-focused, etc. – and speak to whom the organization considers peers. The philosophy should also discuss in relative terms how pay elements (base, bonus, capital accumulation, etc.) should be leveraged in the package to drive/support the compensation objectives.
Inputs vs. Outputs
While we won’t address which specific performance measures to use in this article, it is important to understand what your measures are measuring. Do your measures reflect outputs – the short-term and long-term results of your organization’s purpose – or inputs – measures that are intended to lead to desired outputs? For example, if you are a publicly traded company, then your “output” is total shareholder return. If you are closely held, then output is profit. If you are mission-focused, then your output is “mission achievement”. Most other measures can be considered inputs. Inputs can be measures of organizational effectiveness or management effectiveness.
This distinction is important because the selection and relative weighting of outputs and inputs is directly related to your compensation philosophy and expectation of executive performance. If your measures are strictly outputs, then how the outputs are achieved is much less important and convey a strong message of personal accountability and entrepreneurism. Executives are rewarded for figuring out how to achieve outputs. Conversely, measuring inputs more heavily communicates a path by which the executives are expected to achieve the outputs. As a simple example, a closely-held company with profit and total revenue measures conveys that, while the output is important (profit), it should be achieved at least partially through total revenue. No cost slashing!
Benchmark vs. Historic
Another issue to address is whether you want to measure performance relative to past organizational performance or relative to objective benchmark data. Both have their pros and cons.
Benchmark data is extremely valuable in combatting institutional mediocrity. It can help answer the question – how should we be performing? However, benchmark data does frequently suffer because it can never exactly fit any one organization’s particular situation. We often use operating income margin as a measure with hospital clients because it is a good representation of a hospital’s annual fiscal health and benchmark data is generally available. The challenge is that the benchmark data must be significantly refined to use as performance levels in a specific hospital’s annual incentive plan. If our client is a hospital system in a more rural setting, the board may dictate services, such as physician practices, that are required to serve the community but lose money. If operating income margin is not a funding measure for an annual incentive but is a performance measure, then benchmark operating income margin data must be tailored to represent hospitals in similar service delivery circumstances to determine the specific hospital’s relative effectiveness.
Using historic data can also be a very valuable resource when determining potential performance levels and subsequent payout opportunities, particularly if there is a desire to determine the difficulty of achievement. It is much more effective than benchmark data at helping to determine the level of difficulty in achieving each performance level for measures. For example, one of our publicly-traded clients uses return on equity (ROE) as an input measure of management effectiveness and we utilize historic ROE data to help establish performance levels in its annual incentive plan. The ROE at the expected performance level has been achieved 10 of the last 15 years, while the ROE at the highest performance level has only been achieved once in 15 years.
Like performance reviews where ratings are based on expectations derived from the employee’s last review, over-reliance on historic data can lead to institutional mediocrity or, worse yet, failure. Without an external validation of how well the organization could be performing, historical data alone could simply lead to the same performance, good or bad, as achieved in the past.
An Example: Aligning Pay and Performance
The major purpose of this article is to help organizations focus on targeting performance and then aligning the pay for the results achieved. The following example is a simple summary of a client engagement where we helped the Compensation Committee articular its executive compensation objectives and develop a TDC program for the CEO that was aligned with the type and level of performance the Committee desired.
As mentioned at the outset, the first step in our engagement was to help the Committee establish the role of compensation in organizational performance and executive performance management and articulate a philosophy that supports these two. A simple statement, like the example below, was one result of our collaboration that helped set the stage for defining performance.
“The Compensation Committee desires to provide a performance-based total compensation package that is fair to both the organization and the President & CEO. The package is designed to provide market median (50th percentile) total direct compensation for baseline performance with the opportunity for 75th percentile or above for outstanding or extremely successful performance.”
In addition to base salary, the TDC package consisted of an annual incentive plan and a cash-based long-term incentive plan. The annual plan utilized a balanced scorecard with weighted financial, operational, and stakeholder satisfaction measures. We utilized input and/or output measures for each of the balanced performance areas. We also utilized a combination of benchmark and historic data to establish performance levels.
The long-term incentive plan was designed to provide a payout at the end of a four-year period based on the organization’s compound annual revenue growth rate (CAGR). The Committee determined that while CAGR may be perceived as a funding mechanism it was the clearest measure of customers’ satisfaction and entrepreneurial success. In essence, the Committee viewed CAGR as an “output” rather than an “input”.
In determining performance levels, we employed both benchmark and historic data. As shown in the chart below, the median (50th percentile) four-year CAGR of peer organizations was 6%. The highest among peer organizations was 15%.

Rather than developing descriptive statistics on the organization’s historic CAGR performance, we analyzed the percentage of years the organization achieved specific CAGR performance levels. As shown below, the organization achieved at least 4% CAGR almost 90% percent of the time and achieved 15% CAGR less than 10% of the time.

Using the benchmark and historic data sources, we worked with the Committee to align performance and the market posture of the CEO’s TDC program. The Committee “expected” the CEO’s performance level to be above baseline, so the “Expected” CAGR performance level was above the peer median and had only a 65%-75% probability of achievement based on historic performance. At that performance level, the Committee was willing to provide a long-term incentive payout that, when combined with base salary and annual incentive, would deliver about 60th percentile TDC.
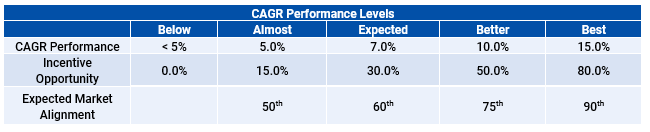
The real value in our approach is not aligning expected performance with middle-of-the-road compensation. As shown above, the Committee was also able to establish both what it considered to be best case performance and a compensation level commensurate with its achievement. 15% CAGR was the highest in the peer group and historically the organization achieved it rarely. If performance rose to the 15% level, then the Committee determined that it would be happy to make the CEO one of the highest compensated among peers – at the 90th percentile as determined by our analysis.